Instagram’s Neighborhood Flavors
Any city dweller can point out their city’s hipster neighborhood, tourist neighborhood, and club neighborhood, yet these categories can be hard to quantify without already knowing what you’re looking for. Neighborhoods have distinct institutions, types of stores, and demographics that jointly contribute to feel. But what about less tangible traits? The funky neighborhood? The youthful neighborhood? In this post, we use Instagram hashtags to discover nationwide neighborhood “flavors.”
Using a bit of statistical jujitsu, we show that groups of hashtags occur together in specific categories of neighborhoods across the country: the artisanal hipsters (#saison, #upcycle, #chickens), the downtown shoppers (#verawang, #architectureporn, #mensshoes), the foodies (#tapas, #rawbar, #crudo), the families (#thatsmybaby, #runningerrands, #homeworkout), and the bohemian urbanists (#brunchlife, #rooftopview, #livejazz). Then we calculate the flavor-distance between any two neighborhoods, and find similar neighborhoods in different cities. What is the Williamsburg of San Francisco? Why, the Mission. (Maybe you already knew that. But did you know the Williamsburg of Dallas is Casa Linda?)
Data
For this study, we consider all U.S. geo-annotated Instagram posts that used hashtags between October 2014 and July 2015. All data were anonymized and analyzed in aggregate; researchers did not analyze any individual’s location or account. We map hashtags to neighborhood boundaries for U.S. cities. These neighborhoods contain 24% of hashtagged, geolocated posts. To avoid spammers, we count the number of unique Instagrammers who used each hashtag in each neighborhood, and only consider hashtags with at least 1,000 unique users in the United States during our time period.
Flavorful Hashtags
To categorize neighborhoods, we want types (our “flavors”) that span many cities but differentiate neighborhoods within them. Among #tbt (“throwback thursday”), #sfpride2015, #libertybell, and #foodtrucks, only the last intuitively seems to have the right mix: it occurs in multiple cities but only in certain neighborhoods within each city. #tbt occurs everywhere, and fails to distinguish one neighborhood from another. #sfpride2015 (common all over San Francisco) and #libertybell (common in certain Philadelphia neighborhoods) are too city-specific. But #foodtrucks, a priori, seems like the type of tag that will occur in many cities, but target only the foodie neighborhoods.

Figure 1 maps this intuition. For Philadelphia (top row) and San Francisco (bottom), we map the pointwise mutual information (PMI) of the given hashtags in each neighborhood.[1] This measures the relative prevalence of the hashtag in each neighborhood, using the national rate as a baseline. #tbt carries no city or neighborhood information; it is as prevalent in Philadelphia and San Francisco as in the nation at large, and is evenly distributed in neighborhoods within them. #sfpride2015 occurs disproportionately in San Francisco, but within San Francisco is used in many neighborhoods; it carries a lot of city information, but little neighborhood information. #libertybell carries both; it is limited to only Philadelphia, and within Philadelphia is limited to only specific neighborhoods. #foodtrucks, finally, hits our sweet spot; it occurs in both cities, but disproportionately in specific neighborhoods within them.
Information Theory and Flavors
We can plot each hashtag on these two dimensions: how much a hashtag occurs in specific states versus how much it occurs in specific neighborhoods.[2] We use information gain, which is a summary measure of how much the distribution of a given hashtag matches the distribution of all hashtags. Hashtags that are much spikier than Instagram usage in general will contain more information. Figure 2 maps the information gain in each dimension for all hashtags with over 1000 unique users.

From bottom to top, hashtags increasingly occur in specific states. From left to right, hashtags increasingly occur in specific neighborhoods within a city. The top left tend to be broad hashtags about a city: #sdlife and #iloveny. Similarly, #snowstorm occurs in specific states, but spares no neighborhood within. The top right are specific places in specific cities: #libertybell and #alamo. The bottom left are tags that are used evenly in cities and neighborhoods: #tbt, #barberlife, #brothers.
The bottom right is ostensibly what we are looking for: neighborhood-specific hashtags in many cities. Except that maybe it isn’t. The extreme bottom right actually pinpoints specific buildings that occur in many cities: #floorseats (sports arenas), #edsheeran (concert halls), #delay (airports), #cheesecakefactory. #jellyfish posts are usually at the aquarium, not the beach. All of these identify a single neighborhood (building, really). These are probably too specific to be a neighborhood flavor.
Instead, our sweet spot is the bottom middle. With most of these hashtags, it’s easy to imagine how they divide each and every city: #singleladies identifies night-life, #growingtoofast residential families with little kids, #bibimbap Korean restaurants.
To limit ourselves to “flavorful” hashtags, for the rest of this analysis we use hashtags only in the bottom middle/right of Figure 2: below #growingtoofast on the y-axis and to the right of #pride and #blackbusiness on the x-axis. This includes the building-specific tags in the bottom right; these neighborhoods will simply form their own topics, such as “airports” and “arenas” which we’ll ignore.
It’s important to realize that there are many possible sources of neighborhood patterns in hashtags. Some of the hashtags are clearly functions of physical traits of a neighborhood: #foodtrucks and #sorority are created because food trucks and sororities are actually present. Others are functions of demographics and culture: #pride in LGBTQ-friendly neighborhoods and #mommylovesyou in family neighborhoods. Interestingly, #sleeve (these posts are full-arm tattoos, not clothing) carries neighborhood information while #tattoo does not; this suggests sleeves are still part of a geographically confined subculture while tattoos have gone mainstream. Other hashtag patterns also operate through culture, but primarily through word-choice. While these researchers believe that people in all neighborhoods have best friends, only people in very specific neighborhoods have #bestfrands (those neighborhoods include Federal Hill, Baltimore; Brooklyn, Jacksonville; and Roxborough, Philadelphia).
Identifying Neighborhood Flavors
Now that we have a set of flavorful hashtags, we want to identify flavors as groups of hashtags that occur together. We fit a topic model [4], treating neighborhoods as documents containing a bag-of-hashtags, with 20 topics. Topic modeling is based on a simple generating process: topics are distributions of hashtags that co-occur. Each neighborhood has its own distribution over the topics; when a hashtag is generated, first the neighborhood picks one of its topics, then it picks a hashtag from within that topic. A neighborhood can (and will) contain multiple topics.
The model provides two sets of results: (1) each topic has a vector of proportions of hashtags and (2) each neighborhood has a vector of proportions of topics. We have hand-named the topics given the high-scoring tags. Below, we present wordclouds of selected topics with words sized by the topic PMI, or the log relative usage of the hashtag in the topic versus the hashtag overall. The order of topics is random, and not related to prevalence of the topic in the country.
It’s important to note that Instagram users are not a representative set of all members of a neighborhood. When we label neighborhoods by Instagram hashtags, we should keep in mind that this only represents how Instagram users view and use the neighborhood, and not all people in the space.
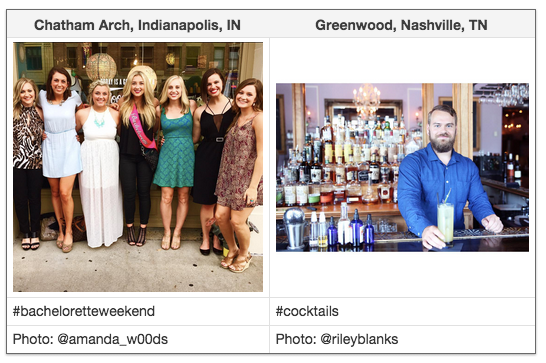
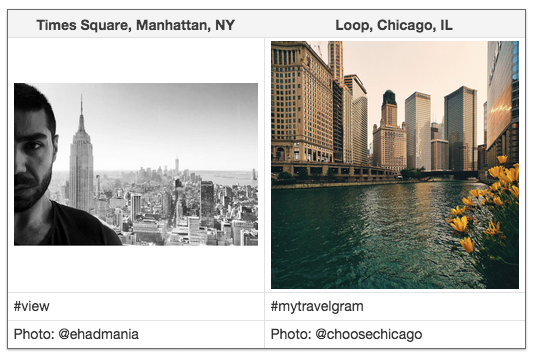
For each topic, I’ve also selected the three neighborhoods with at least 10,000 posts that have the highest score for that topic, limiting to one neighborhood per city.
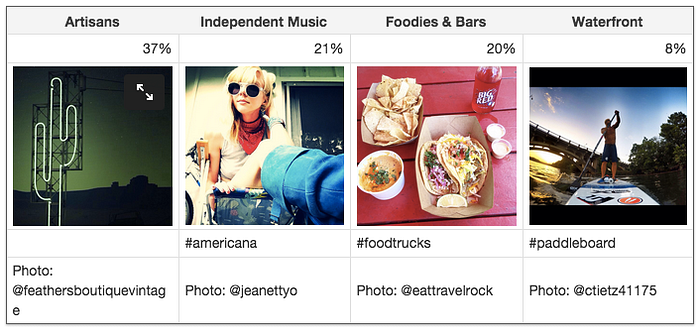
Topic: Foodies and Bars
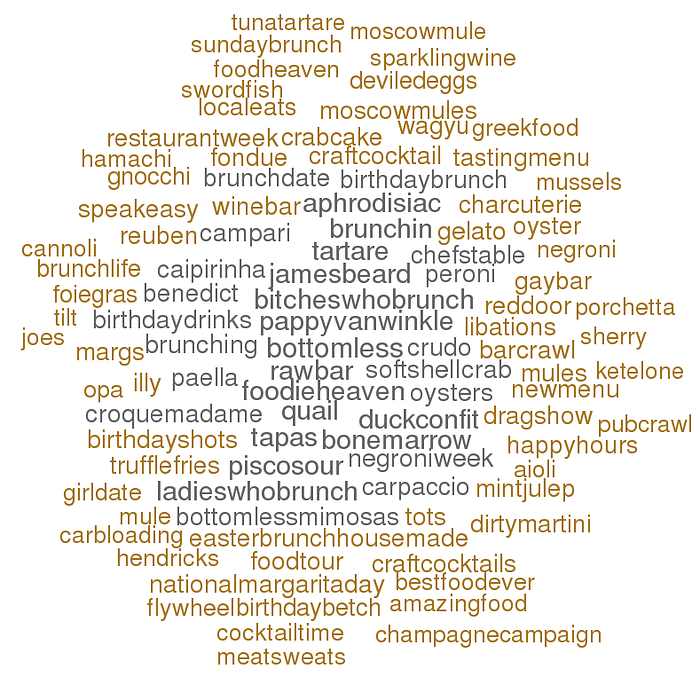
It is undeniable that people like to Instagram about food and alcohol. Especially in these neighborhoods, with #craftcocktails and #trufflefries. We’ve found #foodieheaven.
Topic: Downtown Tourists
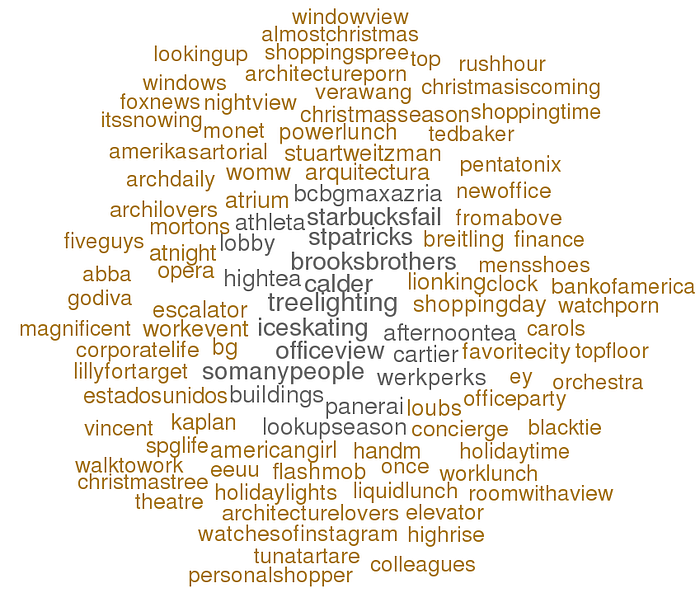
The highest scoring hashtags in this topic are plazas (#treelighting, #iceskating) and offices (#officeview, #powerlunch), but these neighborhoods also draw #architecturelovers and people on #shoppingdays.
Top Neighborhoods
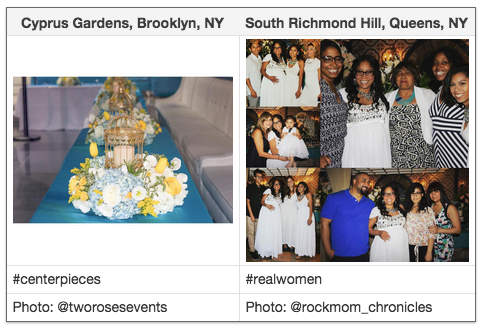
Topic: Home and Family
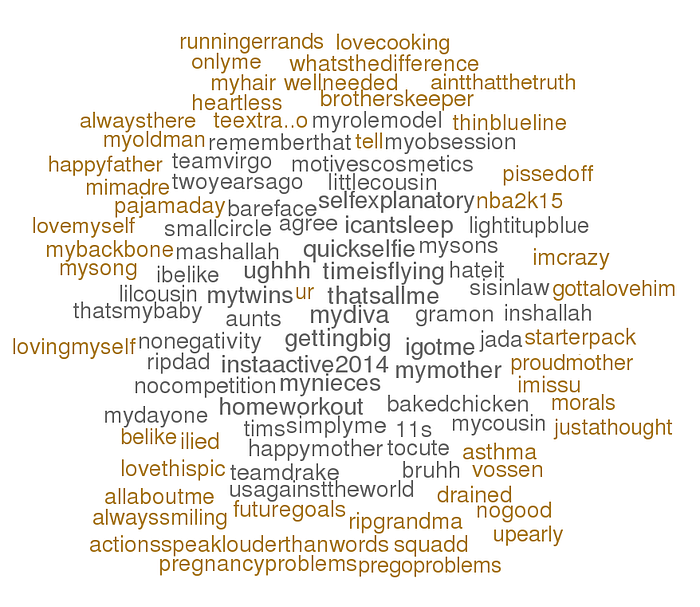
This topic moves to the residential parts of cities. These tags are generally created at home, and either come from parents of young children or soon-to-be (#gettingbig, #pregoproblems, #happymother), call out family (#sisinlaw, #mimadre), or are selfies at home (#pajamaday, #homeworkout, #bareface).
Top Neighborhoods
(Only New York’s residential neighborhoods have enough hashtags to make the 10,000 cut).
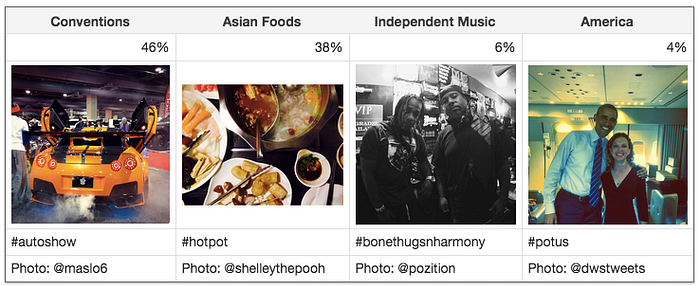
Topic: Asian Foods
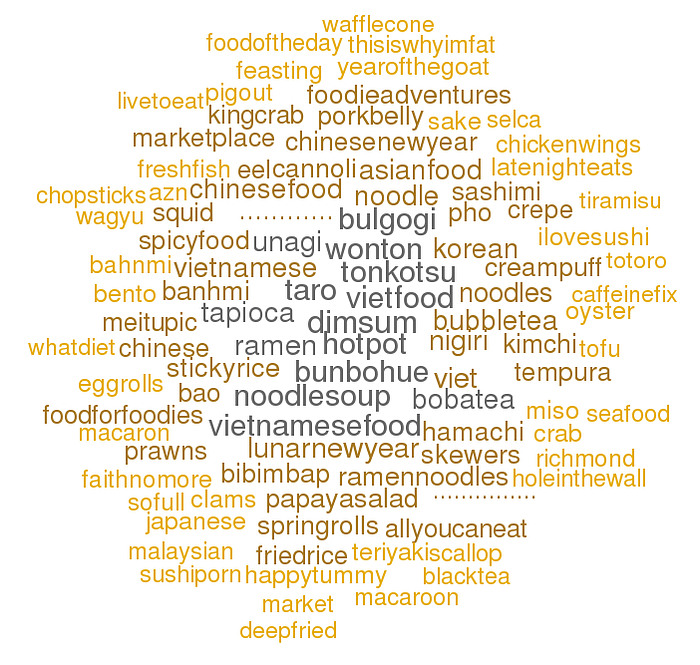
Asian restaurants, and perhaps Asian residents, tend to cluster in similar neighborhoods. With more topics, we would expect the model to differentiate among cultures; here, it identified that broadly, many Asian cultures cluster together. If you want to find the neighborhood with #dimsum, #bibimbap, and #banhmi, this is your flavor.
Top Neighborhoods

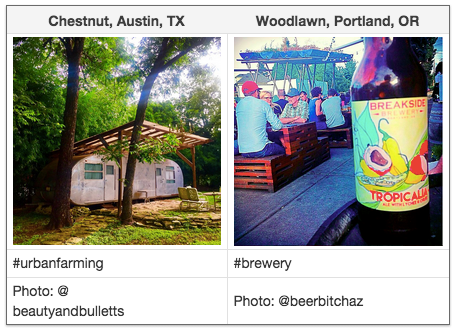
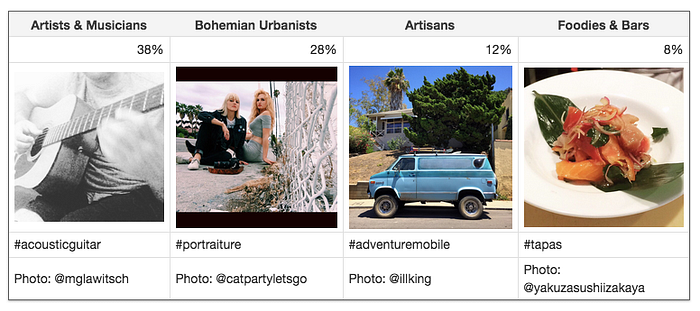
Topic: Artisans

Finally! The artisanal hipsters. The neighborhoods with #distilleries, where people live the #vanlife and practice #glassblowing.
Top Neighborhoods
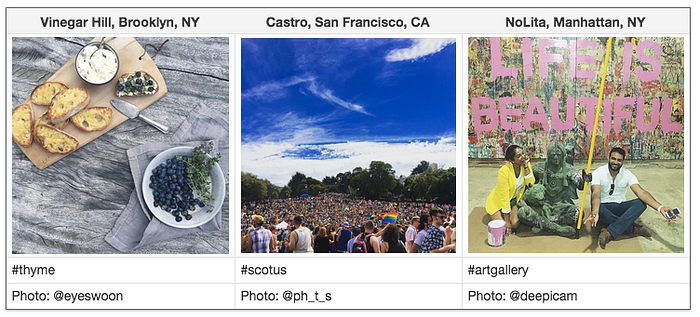
Topic: Bohemian Urbanists
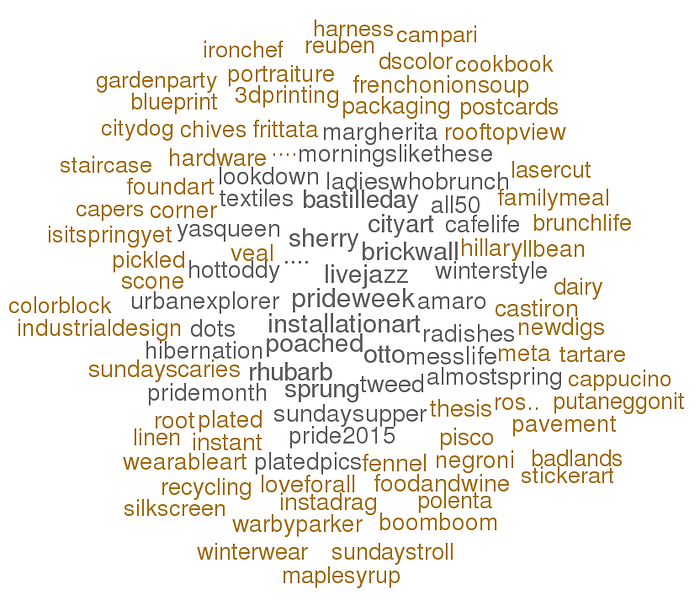
Distinct from the artisans above, the bohemian urbanists post pictures of #cityart, live the #brunchlife, and celebrate LGBTQ-friendly #prideweek. While there is certainly overlap between neighborhoods with these tags and neighborhoods with the artisanal ones, the two sets move in different directions often enough to earn their own flavors.
Top Neighborhoods
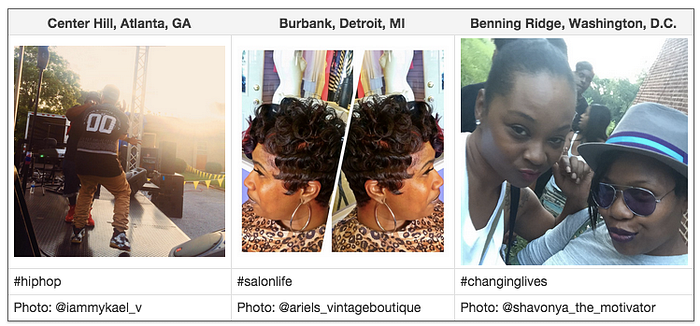
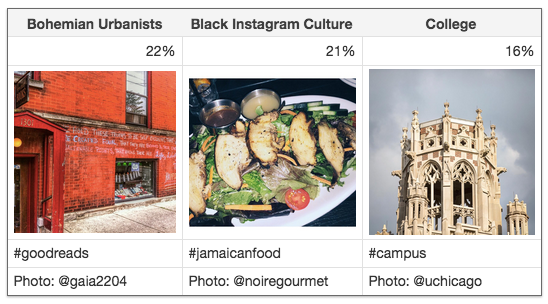
Topic: Black Instagram Culture
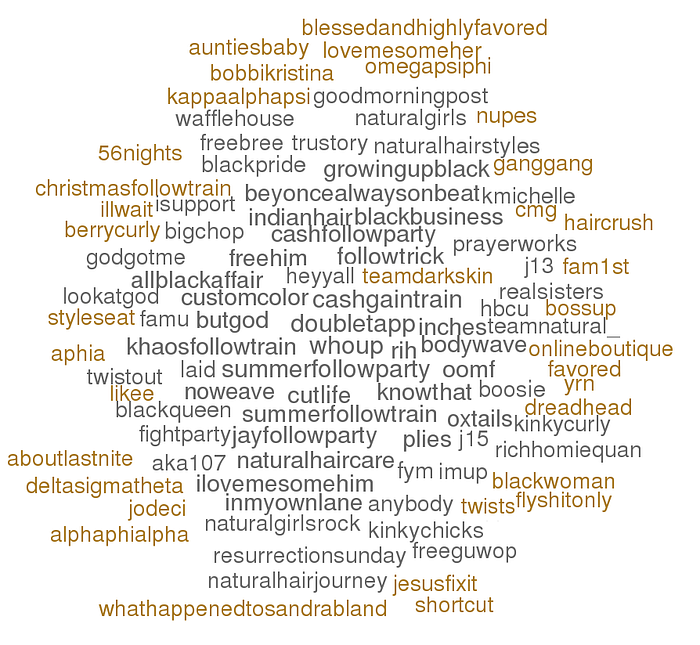
This topic combines groups of hashtags under the umbrella of Black Instagram culture. The leading hashtags are Instagram-related (#doubletapp, #summerfollowparty, #cashgaintrain), but other tags celebrate Black hair (#naturalhairstyles, #twists), name historically Black fraternities and sororities (#alphaphialpha, #deltasigmatheta), and advocate to #freebree, referring to Bree Newsome, who scaled the South Carolina State House flag pole to remove the Confederate flag.
Top Neighborhoods
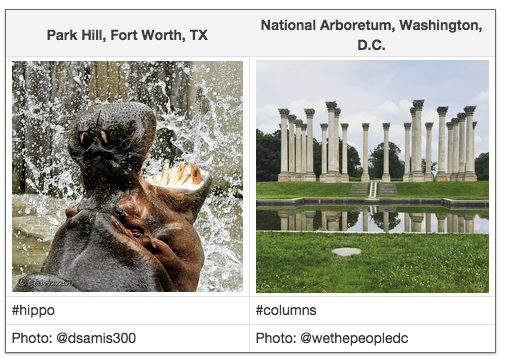
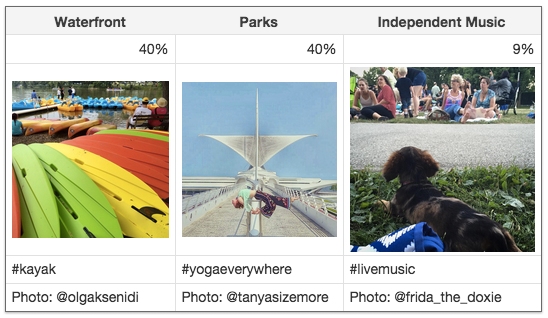
Topic: Parks
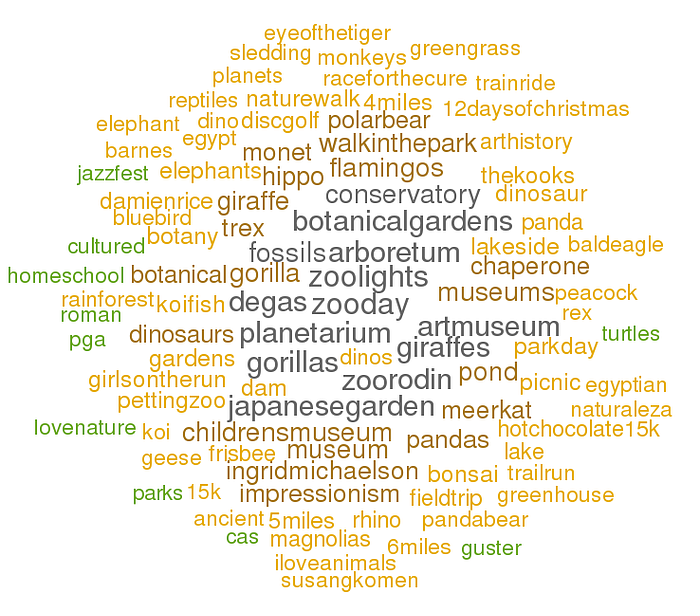
This topic finds the outdoorsy field trip neighborhoods, mostly dominated by #zoos, but with #picnics and #naturewalks sprinkled in.
Top Neighborhoods
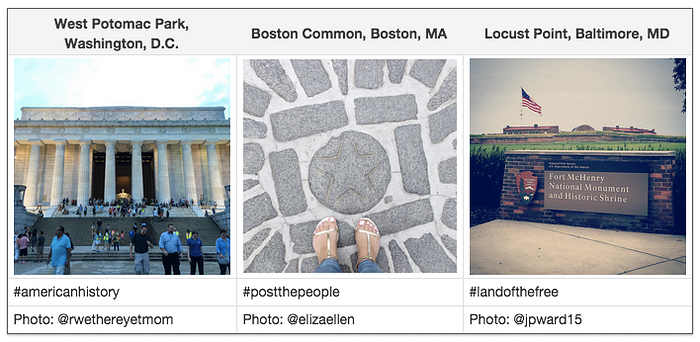
Topic: America
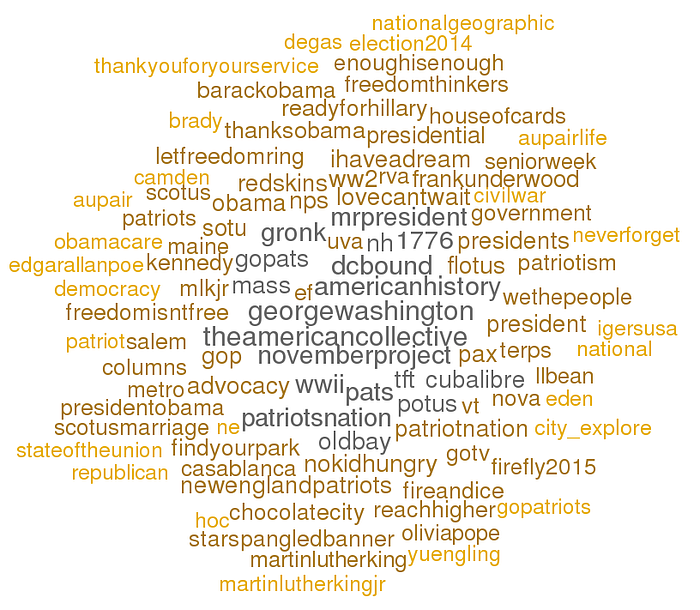
People in these neighborhoods Instagram about America: presidents #georgewashington and #frankunderwood, memorials for #ww2 and #martinlutherkingjr, and the principles #freedomisntfree and #lovecantwait. #brady and #gronk may be happy to learn that the #newenglandpatriots semantically snuck their way into this group.
Top Neighborhoods
Neighborhood Profiles
We can also look at all of the topics present in a given neighborhood. Below, I present the top four topics for a few neighborhoods, and examples of public posts that use one of the topic’s hashtags.
Williamsburg, Brooklyn

Lake Park, Milwaukee
Bouldin Creek, Austin
Hyde Park, Chicago
Central Harlem, Manhattan

Silverlake, Los Angeles
Chinatown, Philadelphia
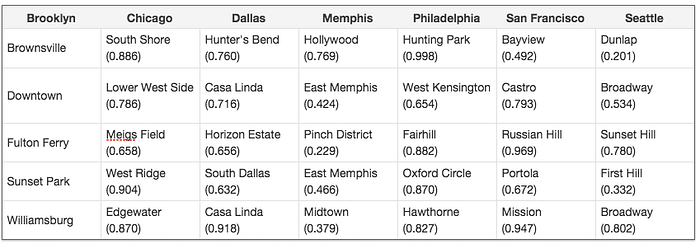
Neighborhood Similarities
We can think of the topic scores as embedding neighborhoods in a 20-dimensional space. With this, we can measure flavor-distance between neighborhoods. We calculate cosine similarity among all neighborhoods, and for selected neighborhoods in Brooklyn, calculate the most similar neighborhoods in Chicago, Dallas, Memphis, Philadelphia, San Francisco, and Seattle. The numbers in parentheses are the cosine similarities, which have a minimum of 0 and a maximum of 1.
Footnotes
[1] Treating each hashtag use as an iid observation of the pair (H = h,N = n), with H a categorical variable for the hashtag and N a categorical variable for the neighborhood, we calculate pmi(h,n) = ln(p(H = h|N = n)/p(H = h)). Probabilities were estimated using a Simple Good-Turing algorithm to avoid over-estimating the importance of small-count occurences.
[2] We use Information Gain in the state, rather than city, because some geographically-specific hashtags still occurred in multiple cities, for example the Bay Area in San Francisco and the five boroughs of New York. Certainly, hashtags that occur in a single city will also occur in a single state. However, hashtags that occur only many neighboring cities will also occur in only one or two states.
[3] We use the definitions InfoGain(S;h) = H(S) — H(S|H=h), and InfoGain(N|C;h) = H(N|C) — H(N|C;H=h), with H(.) standing for the entropy, C a categorical variable over cities, and S a categorical variable over states.
[4] We used the Latent Dirichlet Allocation by Blei, Ng, and Jordan (2003)